We’ve all heard about sea level rise, but it’s also important to know that parts of Aotearoa New Zealand are subsiding, including Waikawa Beach. Add that to the sea level rise and the forecast effects become a bit different.
Sea level rise isn’t uniform around the world — the science over recent years has shown that things are more complicated.
Scientists from the NZ SeaRise Programme have:
calculated the likely rate and direction of vertical land movement for every 2 km of the coast. The variation ranges from 5 mm of uplift a year to more than 8 mm of subsidence a year. It does not account for rapid land movement that might happen during a large earthquake.
Note: turn off any content blockers before trying to use the Maps.
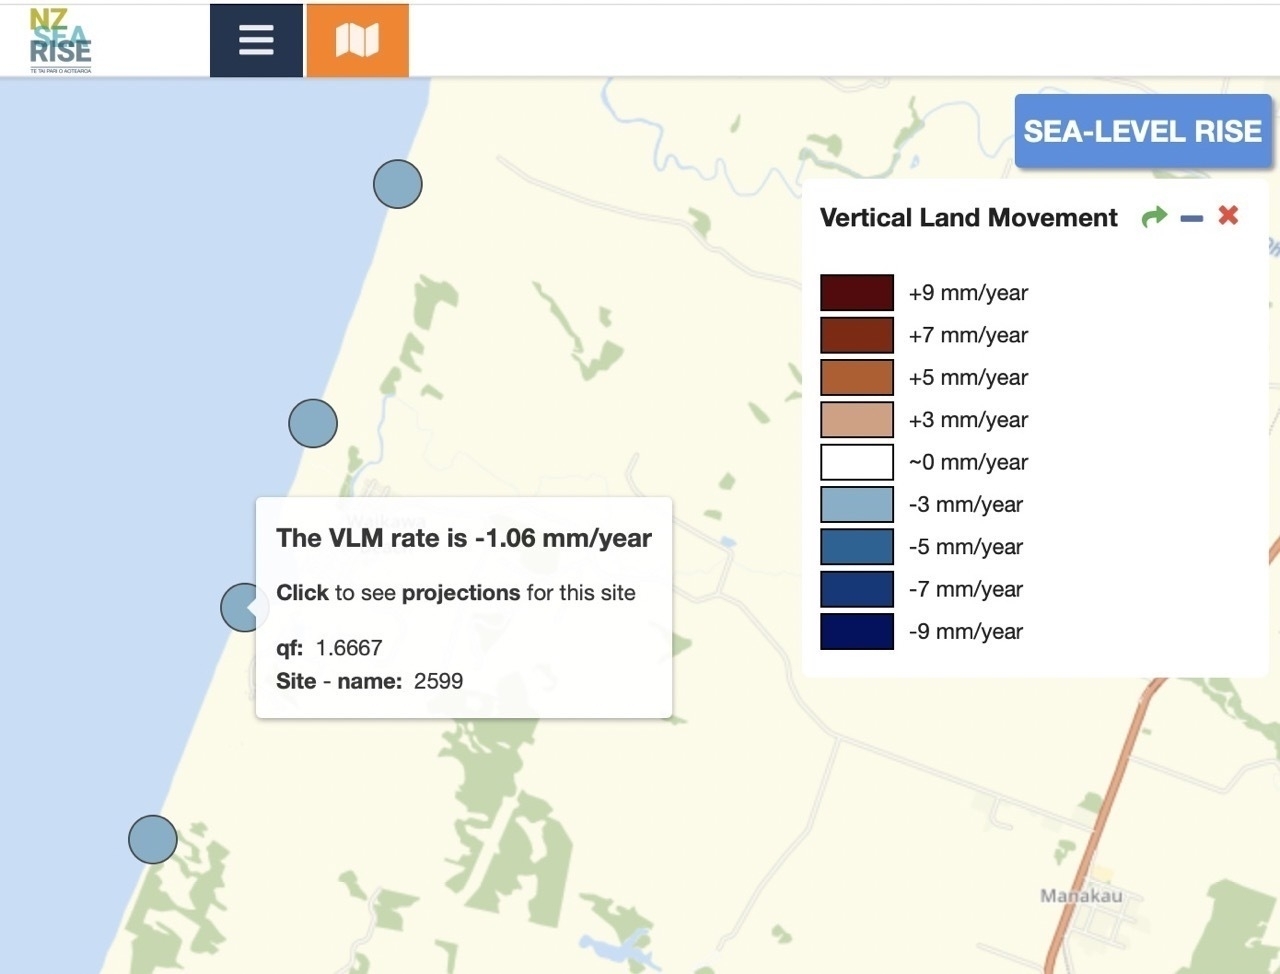
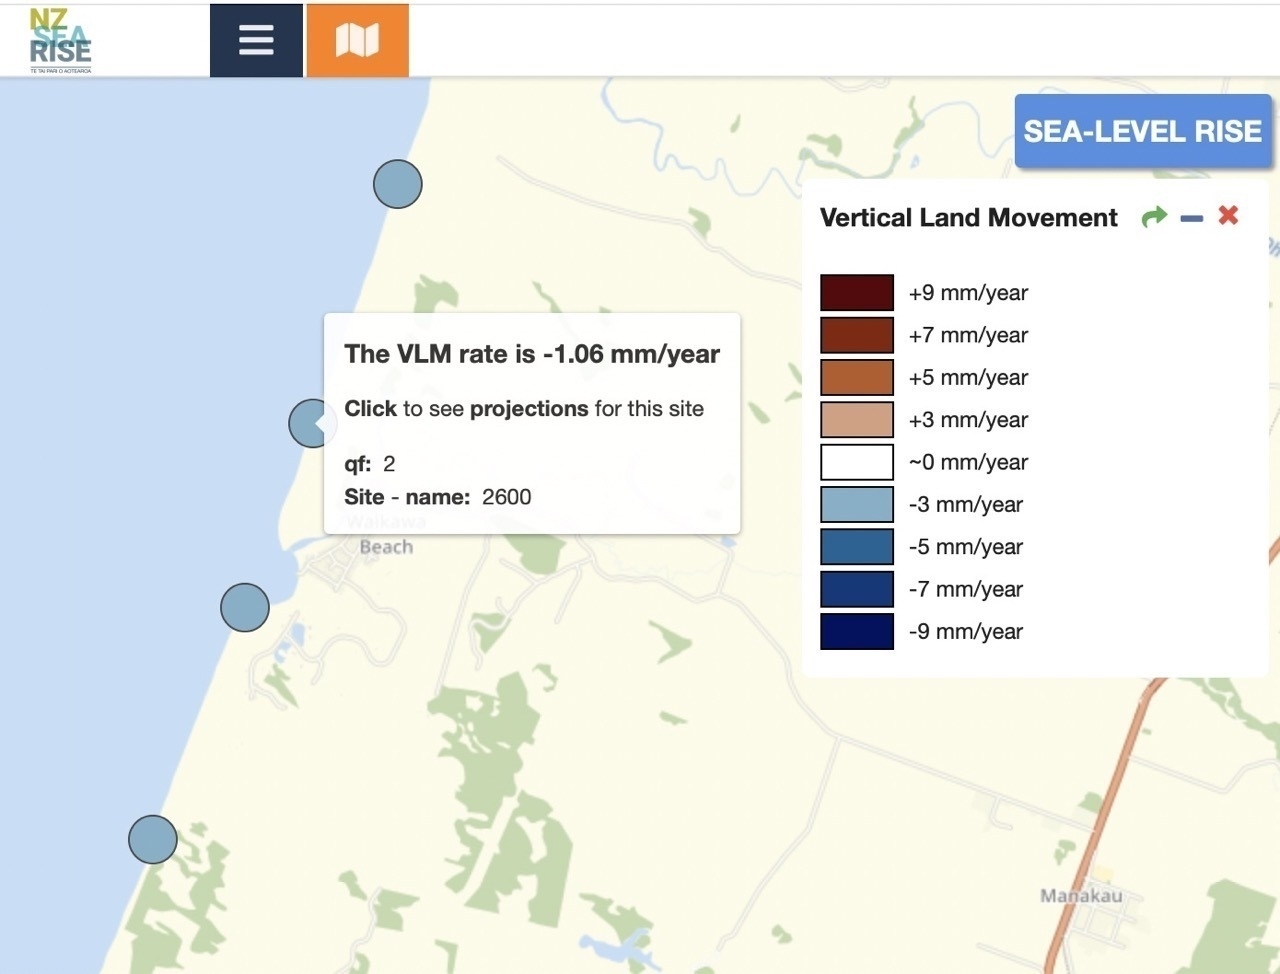
There are 4 locations near Waikawa Beach. All are subsiding a little. At the southern end, near Ōtaki and the northern end, near Ōhau, the land shows subsidence a little greater than at the two locations closest to us. Our subsidence is shown as 1.06 mm per year.
Note: VLM means Vertical Land Movement.
Subsidence means that any sea level rise will have a greater effect because the land will be lower than previously accounted for in models. The website says:
Because Aotearoa is such a tectonically active country, however, we also need to think about vertical land movement. Low lying areas of coastline that are subsiding will experience impacts of sea-level rise at a quicker rate.
See the Map explainer for instructions and information about using the mapping tool.
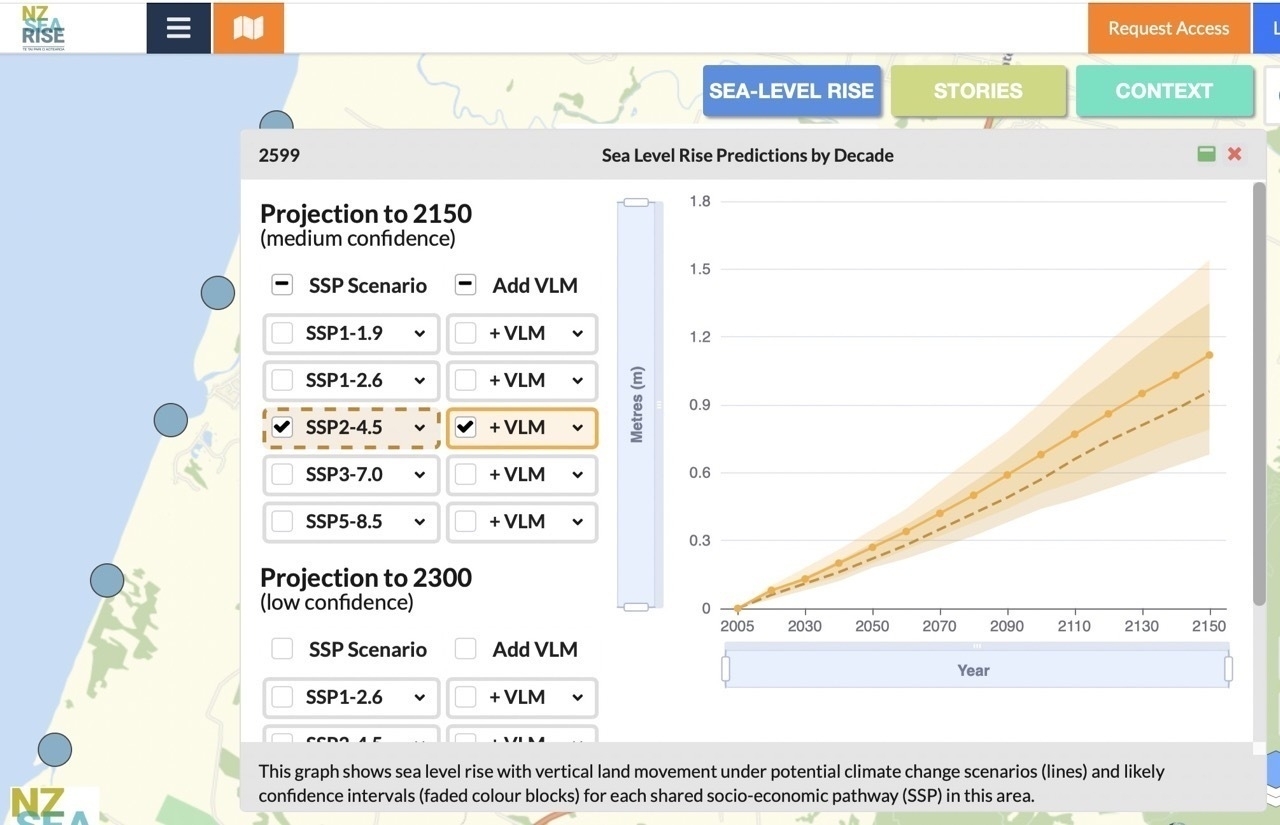
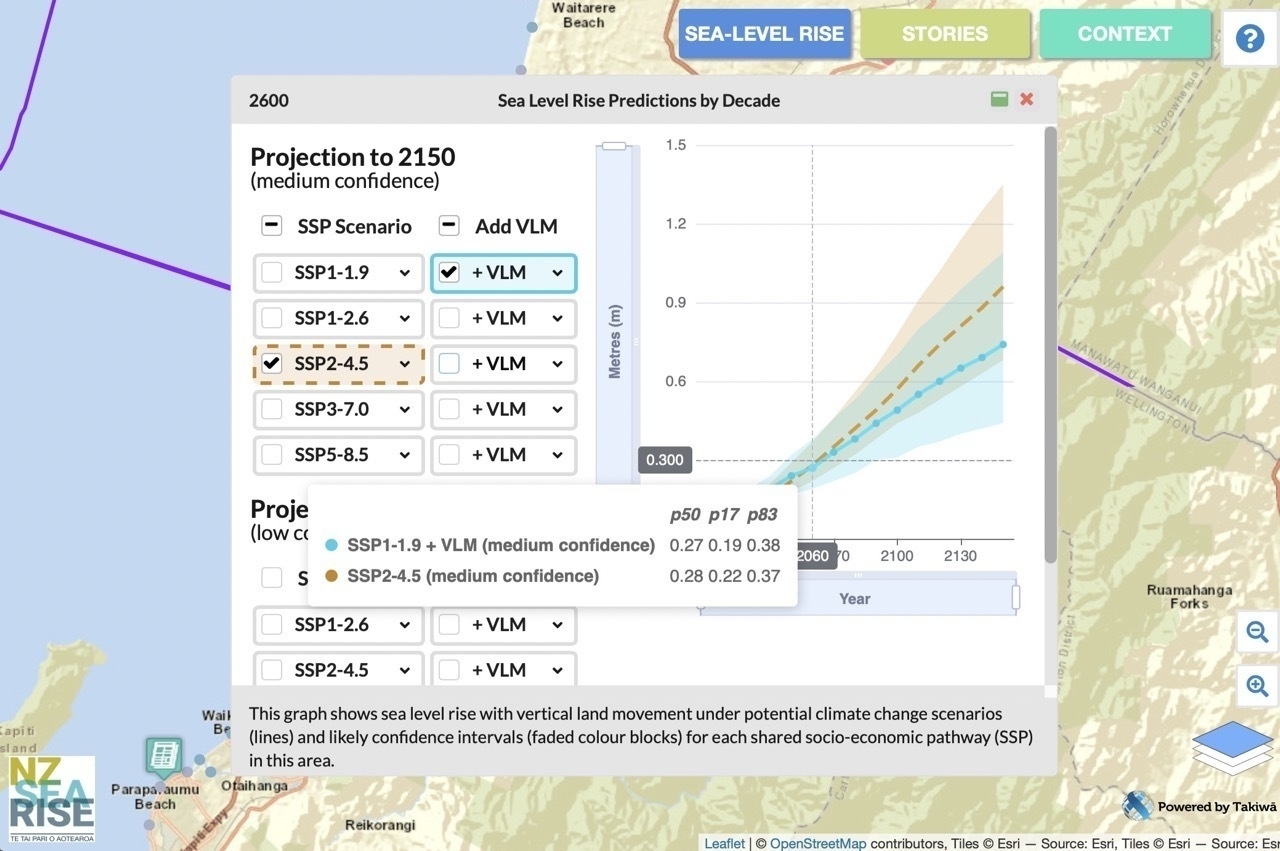
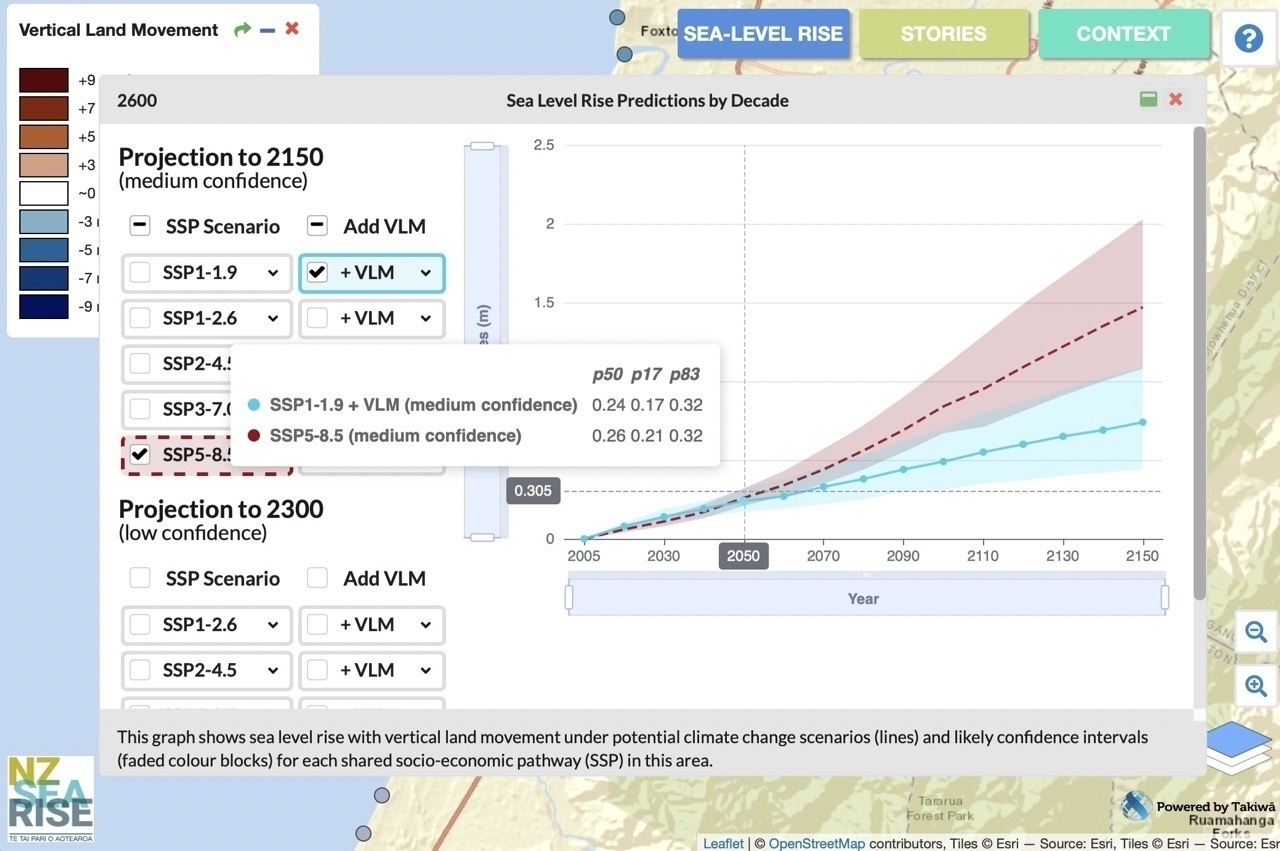
The mapping tool allows us, as a community, to see predictions based on a combination of land subsidence and different climate change scenarios: carrying on as we are now (rapid climate change), making moderate changes, and making dramatic changes (reduced climate change).
Note: shared socio-economic pathway is an important term. It refers to different scenarios for climate change action (my simplistic words) from SSP1 which is working hard to reduce climate change to SSP5 which is doing nothing. Please visit the Wikipedia link above to read a much more nuanced and probably more accurate explanation.
See also: Sinking cities. On that page, which looks closely at a couple of locations, they make the point that:
Surprisingly, small amounts of sea level rise can have devastating impacts: research for former Parliamentary Commissioner for the Environment Jan Wright found just 30 centimetres higher seas would turn a one-in–100 year flood event in Wellington into an annual event for the capital.
Now, I don’t know if that flood-event concern applies equally to us, but the SeaRise charts seem to suggest we could see 30 cm rise at Waikawa Beach somewhere around 2060 if we project small land subsidence with moderate measures against climate change. That is less than 40 years away. Those pre-teens who enjoy Waikawa Beach now will be about 35 by then.
It’s not like 2060 is a cut-off point either — the sea level rise is steadily accumulating. We’ve probably already felt the effects when we have particularly strong storms. Each storm will potentially be just that bit more damaging than the last. We’ve already seen the beach entrance at the end of Manga Pirau Street very much abbreviated by combinations of storm and tide. There may be a lot more land lost yet.
If we combine doing nothing with our low subsidence then the predicted 30 cm rise arrives closer to 2050.
Something else to keep in mind is the river mouth, and the strong tidal flow we see in the river. As the sea-level rises we should expect the river, and the river banks to also feel effects. The downriver portion of Hank Edwards Reserve already floods from time to time. What effect will increased sea level have on properties near the river?
There’s a lot to think about with this new information.