The interactive Climate Central | Coastal Risk Screening Tool is extremely interesting and well worth your time to explore if you own a property at Waikawa Beach.
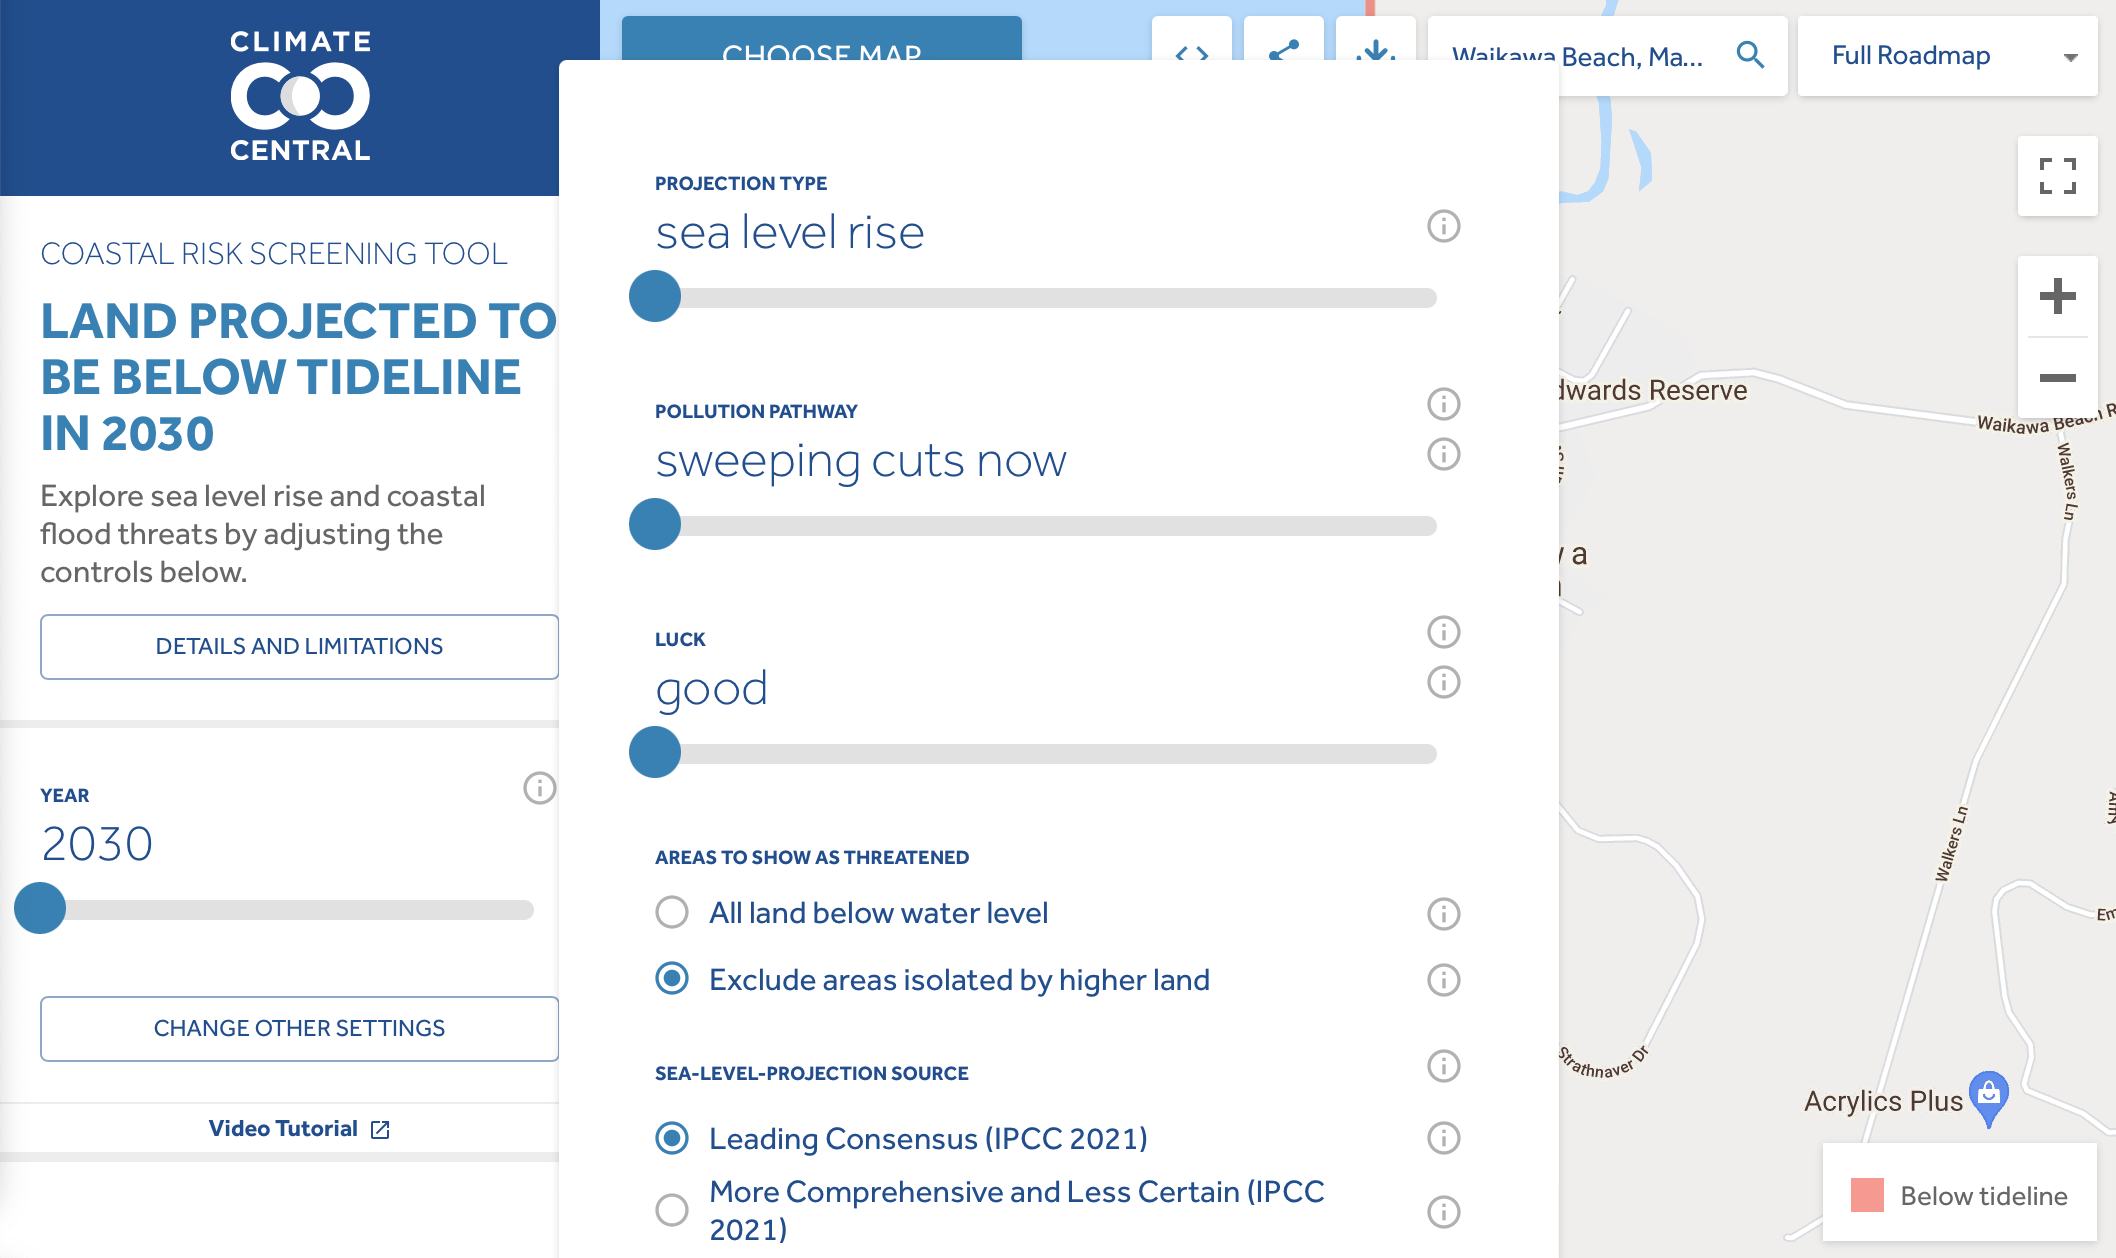
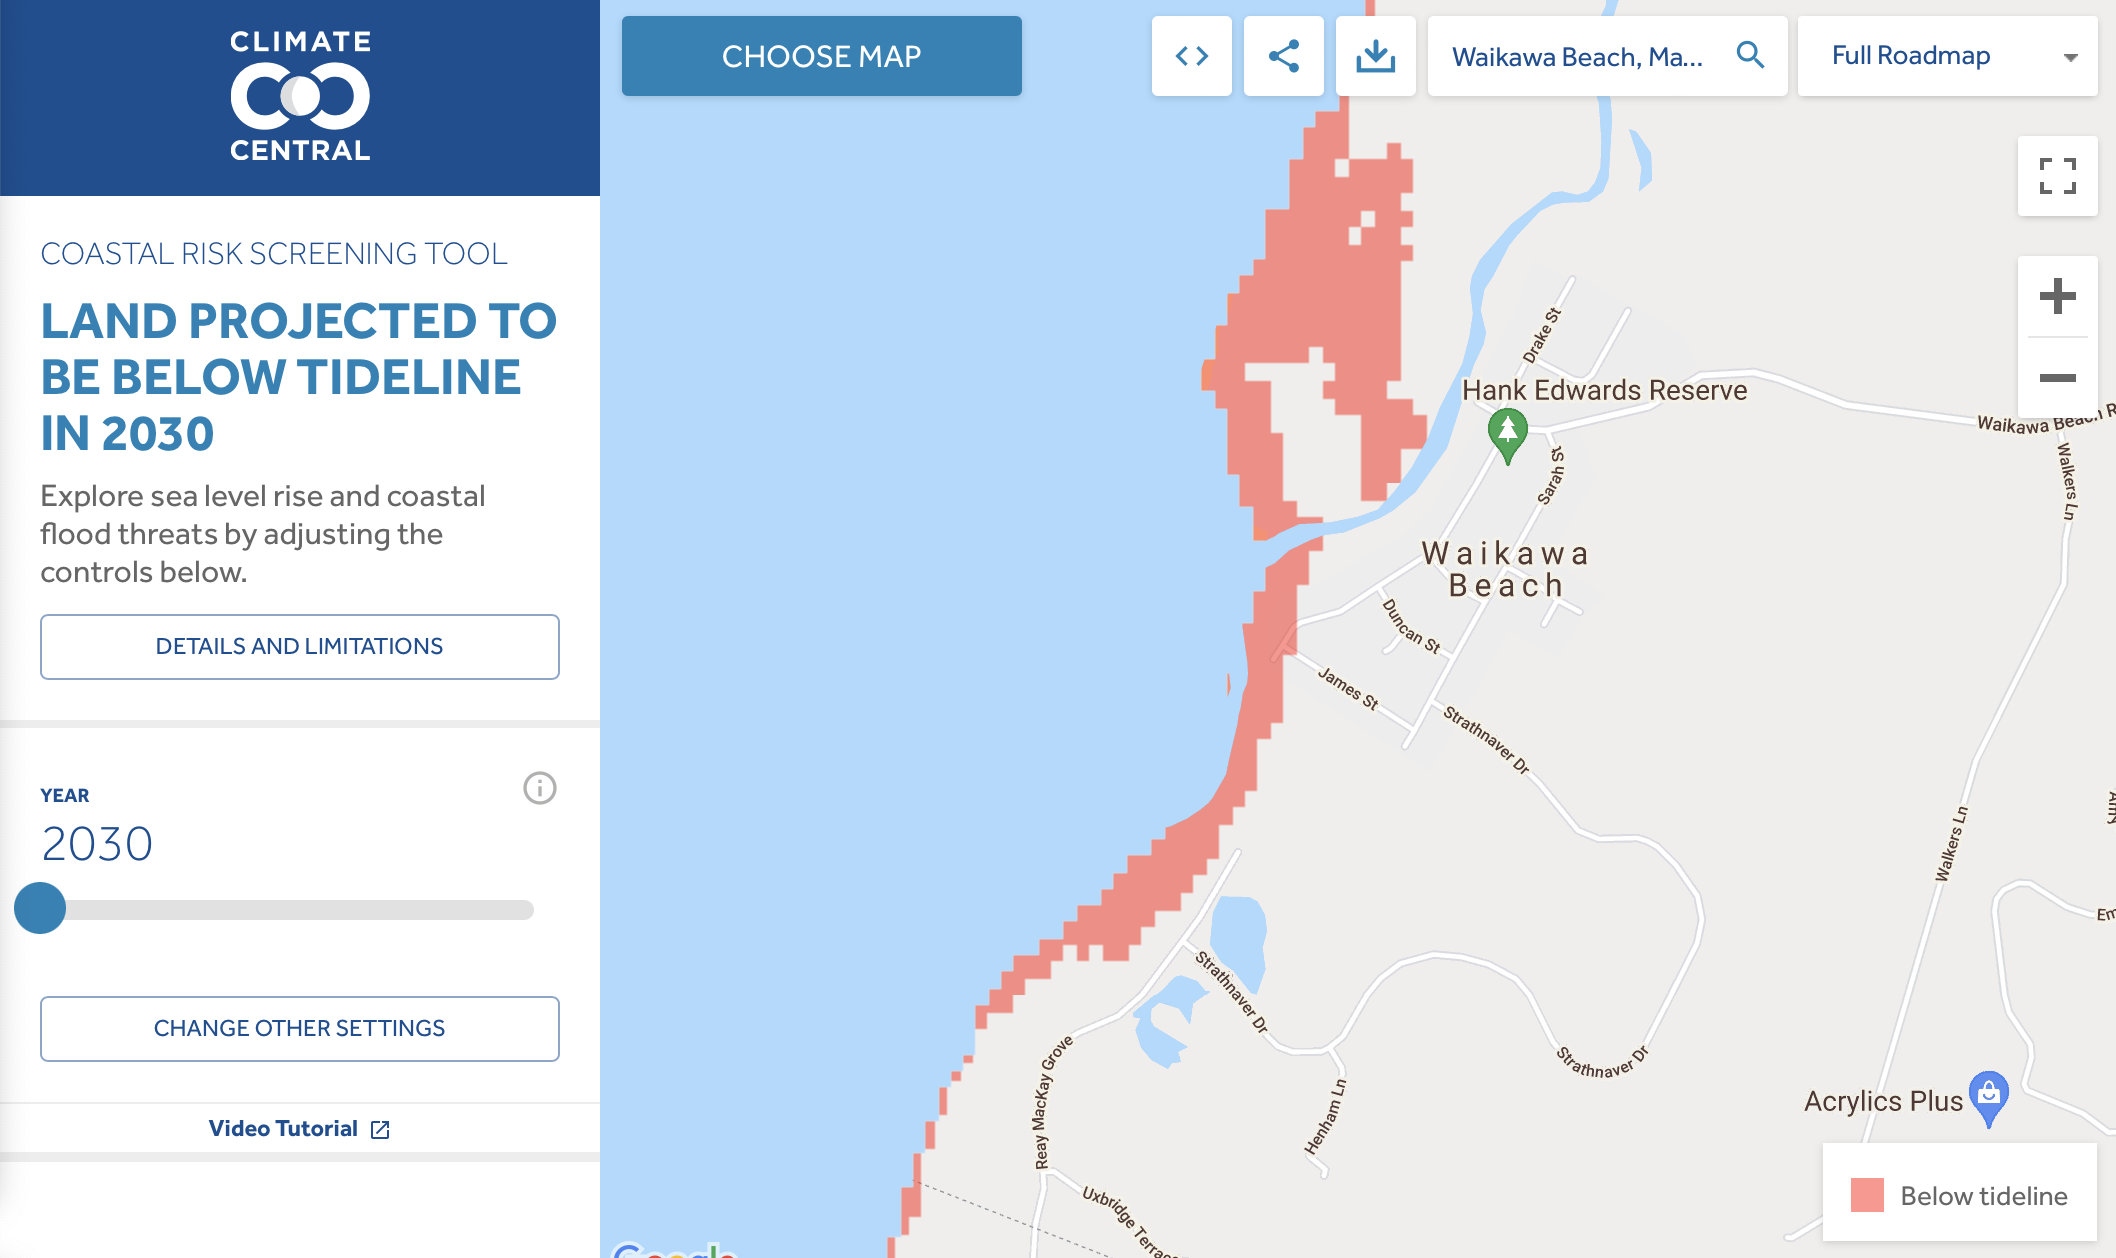
For example, if we choose a best-case scenario with a combination of low sea level rise, immediate sweeping cuts to pollutants such as CO2 and good luck then we can see that in 2030 (less than a decade away now) the coastal ends of Manga Pirau Street and James Street are liable to fall below the tideline.
Tidelineis used to denote the recent historical average of the highest daily local tide level or, technically, the mean higher high water (MHHW) line. … modeled tidal increments are added to recent historical average sea surface heights measured by satellite. Tideline projections add projected sea level rise.
The website allows you to easily find explanations and definitions of terms.
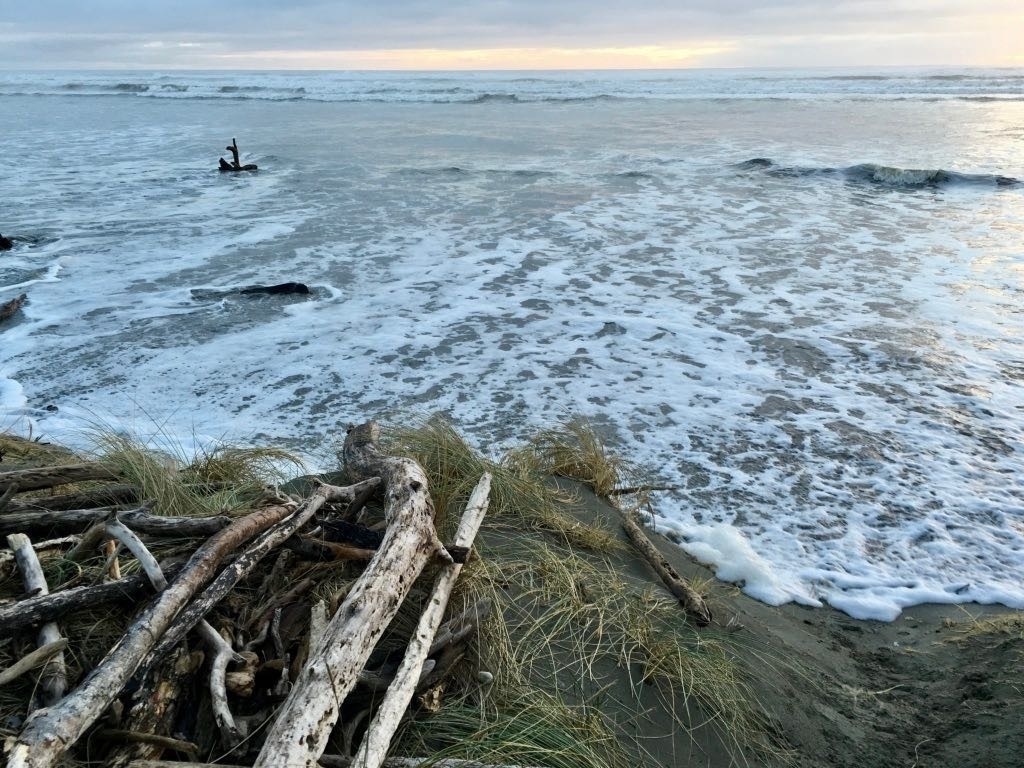
We have certainly seen in the last few years that a combination of heavy rainfall in the Tararuas, gale force westerlies and storm surge can drive river and sea water right up into the dunes, sometimes scouring away sizeable areas of sand.
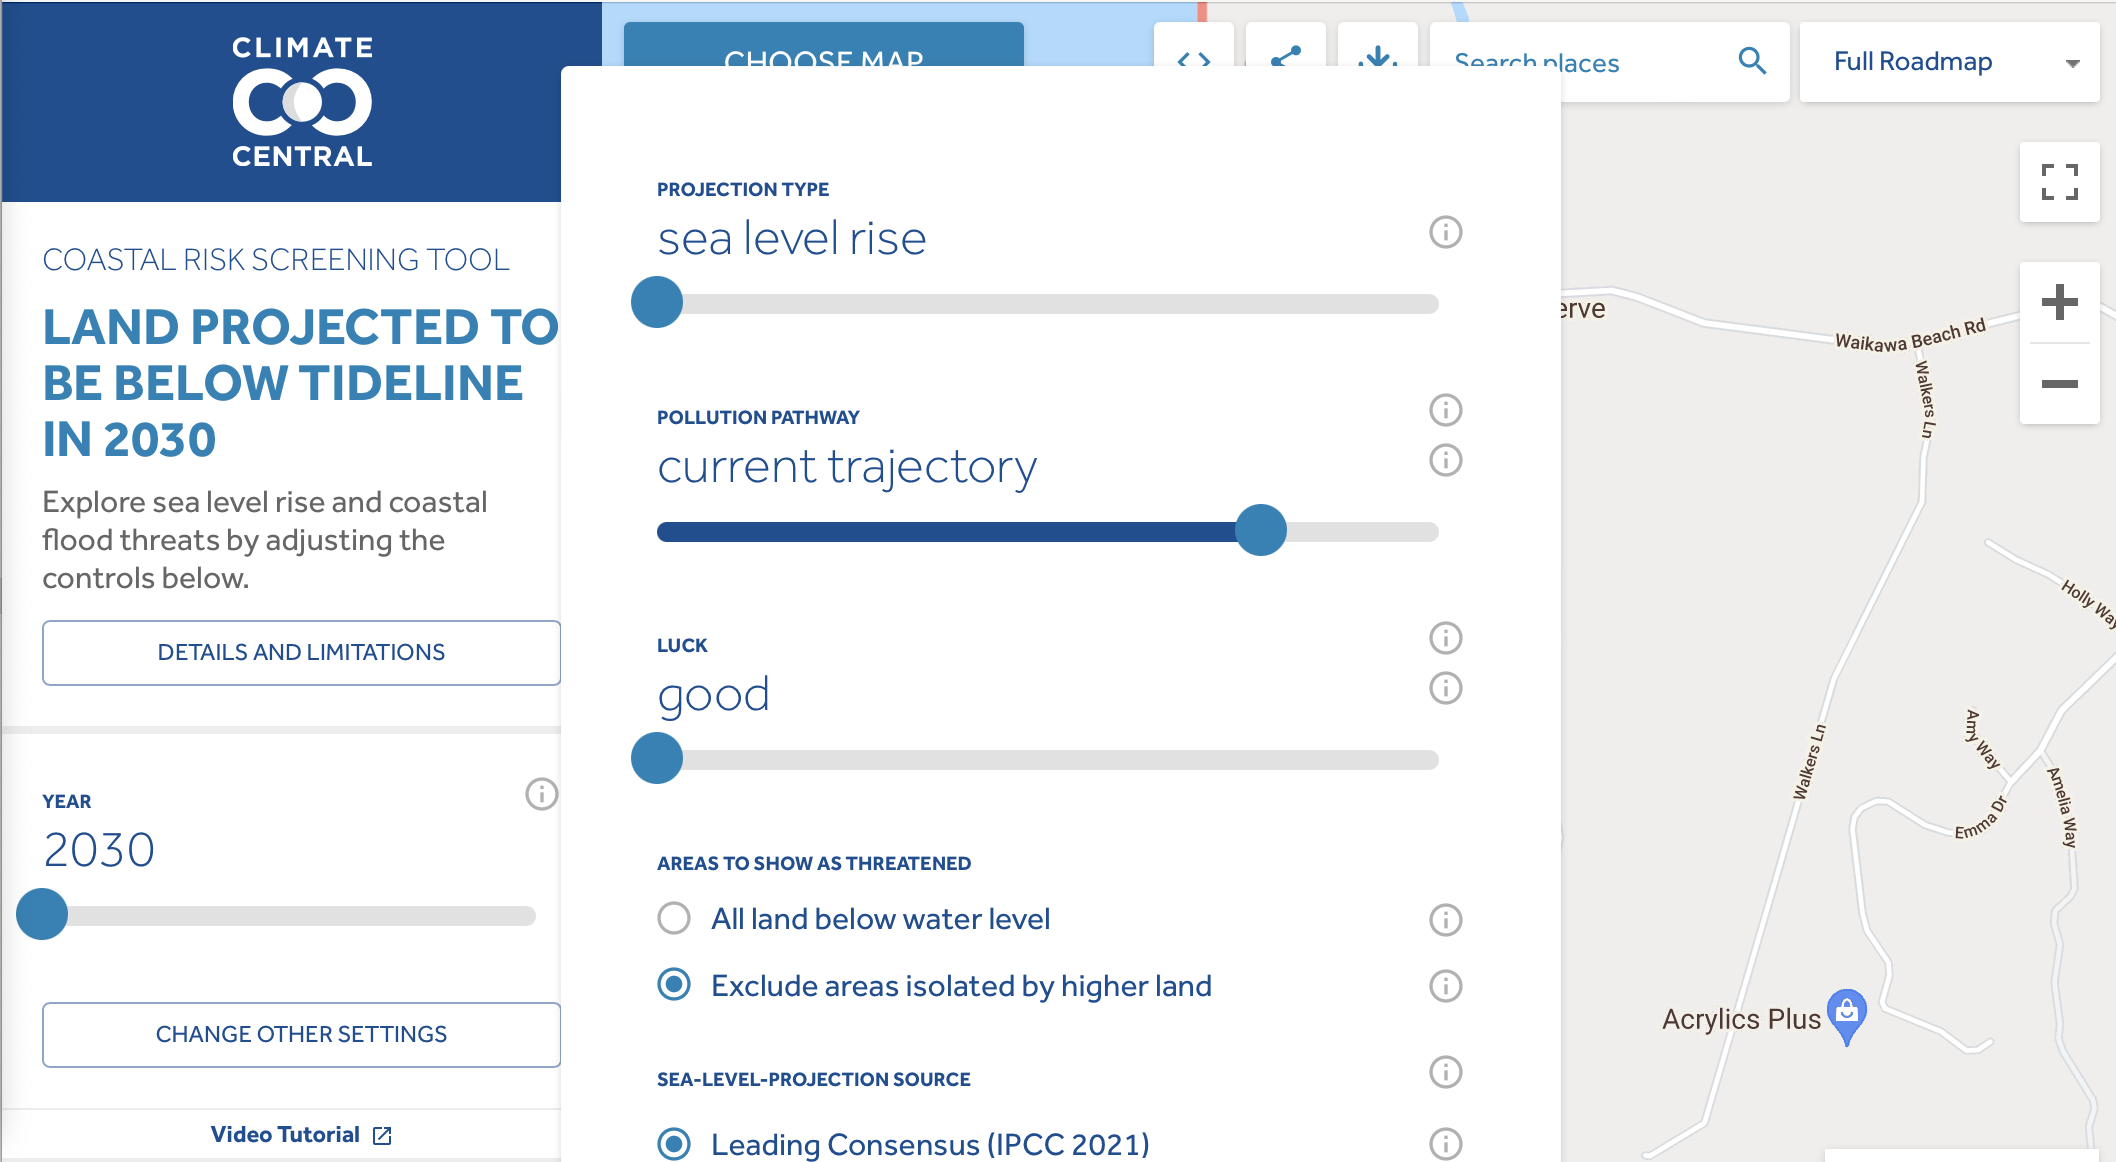
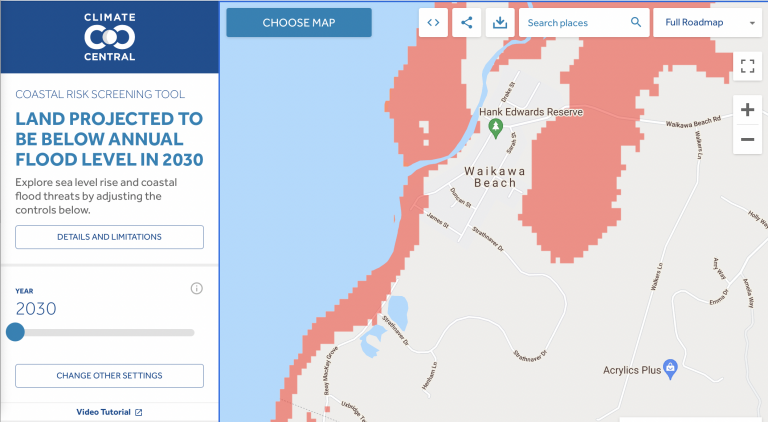
If we look at more pessimistic projections for 2030, such as maintaining our current trajectory on pollutants like CO2, with sea level rise + annual flood and bad luck, the picture changes. Now more of James and Manga Pirau Streets are threatened, along with the northward end of Reay Mackay Grove. Moreover, Waikawa Beach Road could be cut off in a flood between the village entrance and Walkers Lane.
Sea level rise + annual flood:
Local sea level projection plus the added height of a local annual flood. An annual flood's height above sea level is exceeded once per year on average.
There are plenty more combinations to explore, and the forecast can be extended out to 2150. There's a brief video tutorial that's worth watching too for other options available with the map.